


 Login
 Blog
How to Calculate OEE: Formula and Three Worked Examples

TL;DR
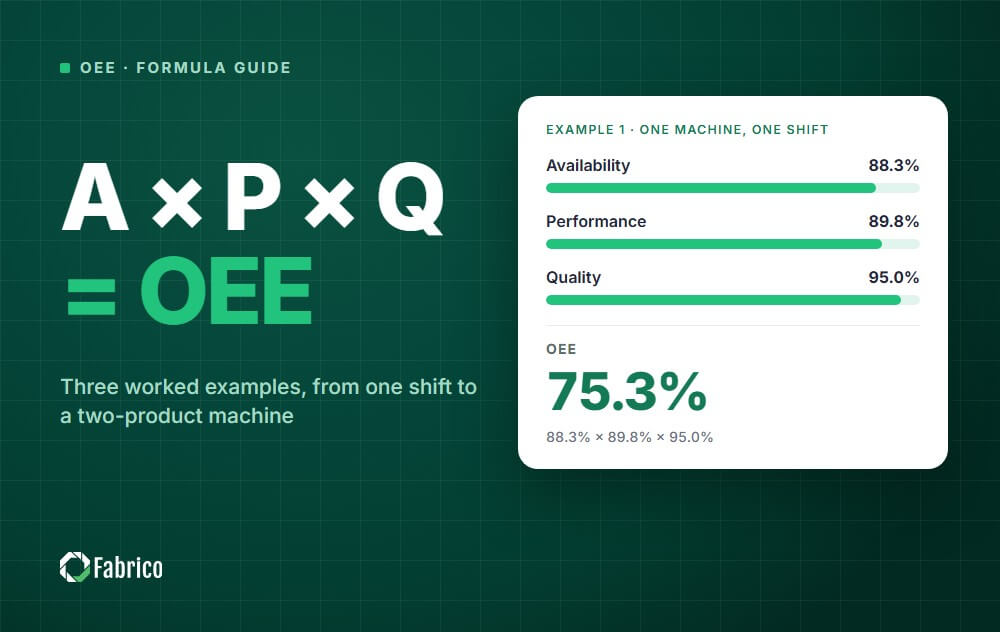
OEE calculation multiplies three factors: Availability × Performance × Quality. In example 1 below, 88.3% × 89.8% × 95.0% gives an OEE of 75.3%. Check any result with one line: good count × ideal cycle time ÷ planned production time.
- OEE = Availability × Performance × Quality. You need six inputs: shift length, breaks and non-production time, stop time, ideal cycle time, total count and reject count.
- Always check your answer with the one-step formula: good count × ideal cycle time ÷ planned production time.
- For machines that run several products, calculate performance from standard time earned, never from an average cycle time.
- For a line or a plant, weight by planned production time. Never average the percentages.
- Round only at the end. Rounding each factor first can shift the final OEE by a tenth of a point or more.
An OEE calculation needs six inputs and one formula.
This page works through three OEE calculation examples, from a single shift to a machine that runs two products. Where planned production time comes from, and the calendar records that decide it, are set out in the shift calendar data model.
The OEE formula at a glance
OEE = Availability × Performance × Quality
| Factor | Formula | Alternative form |
|---|---|---|
| Availability | Run time ÷ planned production time | 1 - (stop time ÷ planned production time) |
| Performance | (Ideal cycle time × total count) ÷ run time | (Total count ÷ run time) ÷ ideal run rate |
| Quality | Good count ÷ total count | 1 - (reject count ÷ total count) |
| OEE | Availability × Performance × Quality | (Good count × ideal cycle time) ÷ planned production time |
If you are new to the metric, start with our complete guide to overall equipment effectiveness. This page focuses on the math.
Once the formula works on paper, a light MES calculates it for every line and shift from the machine signal, so nobody types counts in after the shift.
Once the number is right, OEE analytics shows how to read it and find what to fix first.
What you need before you calculate
Six numbers are enough for a machine that runs one product. The Quality factor is only as good as the scrap record behind it, which is what our scrap reason code taxonomy is for. Collect them for the same period, usually one shift. OEE counts only planned production time; to measure against all calendar time, see TEEP vs OEE.
| Input | What it means |
|---|---|
| Shift length | The total time of the period you are measuring |
| Breaks and non-production time | Breaks, meetings and time with no production scheduled. Changeovers are not included here; they count as stops. |
| Stop time | Stops longer than your short stop threshold during planned production time, such as breakdowns and changeovers |
| Ideal cycle time | The fastest time the machine can make one part under optimal conditions |
| Total count | Every unit produced, good or bad |
| Reject count | Units that were scrapped or needed rework |
The ideal cycle time is the input most often set wrong. Use the design speed or the best demonstrated speed, not last month's average.
Our guide to ideal cycle time shows how to find it.
The same formula, machine by machine on a packaging line: VFFS, flow wrapper, sachet and stick pack, powder filling, bottle filler, labeller, tray sealer, thermoformer, stretch blow moulder, shrink wrapper, cartoner, case packer and palletizer.
OEE calculation example 1: one machine, one shift
A machine runs one eight-hour shift. Here is the data.
| Input | Value |
|---|---|
| Shift length | 480 minutes |
| Breaks | 45 minutes |
| Stop time | 51 minutes (29 breakdown, 22 changeover) |
| Ideal cycle time | 45 seconds (0.75 minutes) |
| Total count | 460 units |
| Reject count | 23 units |
Step 1: planned production time and run time
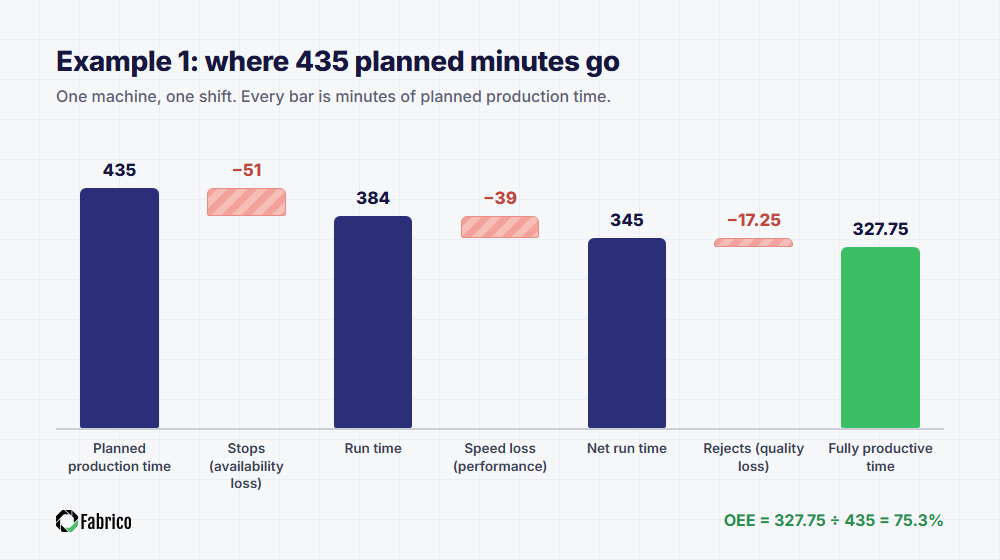
- Planned production time = 480 - 45 = 435 minutes
- Run time = 435 - 51 = 384 minutes
Step 2: availability
Availability = 384 ÷ 435 = 88.3%
The changeover counts as a stop here, because it happened inside planned production time.
Step 3: performance
Performance = (0.75 × 460) ÷ 384 = 345 ÷ 384 = 89.8%
You get the same answer with rates. The ideal rate is 80 units per hour.
The actual rate was 460 ÷ 6.4 hours = 71.875 units per hour, and 71.875 ÷ 80 = 89.8%.
Step 4: quality
Good count = 460 - 23 = 437 units.
Quality = 437 ÷ 460 = 95.0%
Step 5: OEE, and the check
OEE = 88.3% × 89.8% × 95.0% = 75.3%
Now check it: 437 × 0.75 ÷ 435 = 327.75 ÷ 435 = 75.3%.
The two methods agree, so the arithmetic is right. The check cannot catch a wrong input, such as an ideal cycle time that is set too slow.
Is 75.3% good? The widely quoted world-class figure is 85%, and published figures sit lower.
Once you have the formula, put a price on the gap. Why Lines Stop, our free field guide, shows how to cost one stopped hour on your line.
OEE calculation example 2: a high-speed line measured in units per minute
Fast lines are easier to calculate with rates than with cycle times.
| Input | Value |
|---|---|
| Planned production time | 450 minutes |
| Stop time | 38 minutes |
| Ideal run rate | 200 bottles per minute |
| Total count | 72,100 bottles |
| Reject count | 1,080 bottles |
- Run time = 450 - 38 = 412 minutes
- Availability = 412 ÷ 450 = 91.6%
- Performance = 72,100 ÷ (412 × 200) = 72,100 ÷ 82,400 = 87.5%
- Quality = 71,020 ÷ 72,100 = 98.5%
- OEE = 91.6% × 87.5% × 98.5% = 78.9%
Check: 71,020 good bottles ÷ (200 × 450) = 71,020 ÷ 90,000 = 78.9%.
On a line like this, performance is the biggest loss. That usually points to short stops and speed reductions, not breakdowns.
Our guide to micro stops explains how to find them.
OEE calculation example 3: one machine, two products
This is where most spreadsheets go wrong.
A machine runs two products in one shift, with 440 minutes of planned production time and 400 minutes of run time.
| Product | Ideal cycle | Count | Rejects | Time earned |
|---|---|---|---|---|
| A | 0.6 min | 300 | 9 | 180 min (300 × 0.6) |
| B | 1.2 min | 150 | 6 | 180 min (150 × 1.2) |
| Total | 450 | 15 | 360 min |
The right way
- Availability = 400 ÷ 440 = 90.9%
- Performance = standard time earned ÷ run time = 360 ÷ 400 = 90.0%
- Good standard time = (291 × 0.6) + (144 × 1.2) = 174.6 + 172.8 = 347.4 minutes
- Quality = 347.4 ÷ 360 = 96.5%
- OEE = 347.4 ÷ 440 = 79.0%
Quality is weighted by standard time here, because a rejected B unit costs twice the time of a rejected A unit.
The plain count, 435 ÷ 450 = 96.7%, would not multiply back to the one-step result.
The wrong way
Take the average cycle time, 0.9 minutes, and multiply it by all 450 units. That gives 405 minutes of "earned" time in 400 minutes of running.
Performance comes out at 101.3%, which is impossible. The average hides the fact that the fast product made most of the units.
OEE for a line or a whole plant
Never average OEE percentages. Add up the times first, then divide.
| Machine | Planned time | Fully productive time | OEE |
|---|---|---|---|
| Machine 1 | 450 min | 360 min | 80% |
| Machine 2 | 150 min | 60 min | 40% |
| Combined | 600 min | 420 min | 70% |
The simple average of 80% and 40% is 60%, which understates the combined result by 10 points.
For a line of machines in series, also look at the bottleneck. Its output sets how much the line can deliver.
See how to calculate OEE for multiple machines.
A calculation template you can copy
Use one row per machine per shift. The last five columns are calculated.
| Column | Formula |
|---|---|
| A. Shift length (min) | Input |
| B. Breaks and non-production time (min) | Input |
| C. Stop time (min) | Input |
| D. Ideal cycle time (min) | Input |
| E. Total count | Input |
| F. Reject count | Input |
| G. Planned production time | A - B |
| H. Availability | (G - C) ÷ G |
| I. Performance | (D × E) ÷ (G - C) |
| J. Quality | (E - F) ÷ E |
| K. OEE | H × I × J |
Add a check column with (E - F) × D ÷ G. It must always equal K.
For a ready-made version, see our OEE Excel template guide, or put a price on your losses with the cost of downtime calculator.
Eight calculation mistakes to avoid
1. Rounding too early
In example 3, multiplying the rounded factors 90.9% × 90.0% × 96.5% gives 78.9%, but the exact result is 79.0%.
Keep full precision until the last step, then round once.
2. Accepting performance above 100%
It is never real. The ideal cycle time is too slow, or the count includes units from another period.
3. Moving changeovers in and out of planned time
If a changeover is left out of planned production time on bad days and counted as a stop on good days, the trend means nothing.
Write the rule down once and apply it to every shift.
4. Using an average cycle time for mixed products
Use standard time earned per product, as in example 3.
5. Counting rework as good
A part that needed rework was not right the first time. It belongs in the reject count.
6. Averaging percentages
Weight by planned production time, or sum the times first.
7. Mixing units
Ideal cycle time in seconds and run time in minutes is the most common spreadsheet error. Convert everything to one unit before you start.
8. Guessing the stop time
Stops written down at the end of a shift are usually shorter and fewer than the real ones.
Automatic data capture removes the guesswork. See OEE data collection methods.
Manual calculation vs automatic calculation
The math is the same either way. The difference is the quality and speed of the inputs.
- Manual: fine for learning and for a first baseline on one machine. Short stops and speed losses are usually underreported.
- Automatic: counts and stops come straight from the machine, so OEE is available during the shift, while there is still time to act.
If your result looks too low or too high, work through why your OEE is low before changing anything on the line.
How Fabrico calculates OEE
Fabrico collects stop time and counts from PLCs, IoT sensors and AI cameras, then calculates availability, performance, quality and OEE (A × P × Q) in real time.
It detects micro stops that manual logs miss, and shows downtime, MTTR and MTBF by machine on a live dashboard. The whole feature set is on the OEE software page, and the availability side is broken out under downtime tracking.
Because Fabrico has a full CMMS built in, your team can turn the losses you calculate into work orders and preventive maintenance plans in the same platform. Data can be exported to Excel at any time.
See your own OEE calculated live: book a demo.
More guides: what OEE means, the six big losses and our Overall Equipment Effectiveness hub.
Frequently asked questions
How do you calculate OEE?
Multiply availability, performance and quality.
Availability is run time ÷ planned production time, performance is (ideal cycle time × total count) ÷ run time, and quality is good count ÷ total count.
What is the simplest OEE formula?
OEE = (good count × ideal cycle time) ÷ planned production time.
It gives the same result as the three-factor formula, but it does not show where the loss is.
How do you calculate availability in OEE?
Divide run time by planned production time.
Run time is planned production time minus all stops longer than your short stop threshold, including breakdowns and changeovers.
How do you calculate performance in OEE?
Multiply the ideal cycle time by the total count, then divide by run time.
For several products, add up the standard time earned for each product and divide by run time.
Why is my OEE performance over 100%?
The ideal cycle time is set slower than the machine can actually run, or the count covers a different period than the run time.
Fix the input rather than capping the result.
Should changeovers be included in OEE?
In the standard approach, yes. Changeovers happen during planned production time, so they reduce availability.
Whatever rule you choose, apply it the same way every shift.
How do you calculate OEE in Excel?
Put the six inputs in columns, then calculate planned production time, availability, performance, quality and OEE in the next columns.
Add a check column with the one-step formula. The template above lists every formula.
See how Fabrico unifies OEE and maintenance in one platform.
Request a demoRelated articles













Real Fabrico tiles, sample data.